Introduction
The hop powdery mildew risk index uses weather data to calculate daily and cumulative risk points that estimate favorability of conditions for infection and generation time of the powdery mildew fungus. Categories of low, moderate, and high risk are assigned based on cumulative risk points. These categories can be used to adjust application intervals of fungicides or other management actions such as fungicide selection and intensity of scouting.
This app is a newer, streamlined interface for the existing model, which is also available through MyPest Page.
Using this App
Select the "Inputs" tab, search for weather stations near you, and choose one either from a list or a map. Be aware that some weather stations have poor quality or missing data. Our software estimates the quality of each station, but you may wish compare results for several nearby stations.
Optionally, you may choose a start date and a span (number) of days. If you leave the start date blank, the end of the output will be five days in the future, using forecast weather data, and the app will count back to a start date in the recent past. The weather forecast data is from the National Weather Service's "NDFD" forecasts.
There are presently two versions of the risk index. The original risk index is appropriate for use on highly susceptible varieties such as "Columbus", "Tomahawk", and "Zeus". However, the original index overestimates risk on less susceptible varieties. A modified risk index calibrated to “Cascade” and similarly susceptible varieties is also available. You can choose to either index or both of them.
Then, select "Graph" or "Table" to run the model. Your output will appear after 10-20 seconds depending on server load.
Interpreting your Results
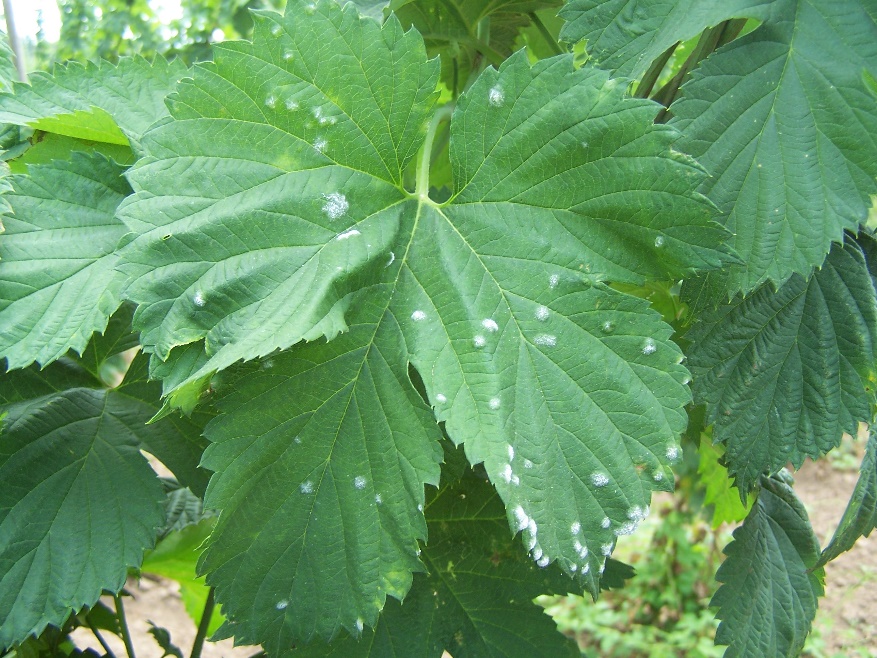
Powdery mildew on leaves is favored by moderate temperatures (60 to 82F) for multiple days and rapid plant growth. Multiple consecutive days of high temperature (>82 to 86F, variety dependent), low temperature (< 60F), or rain reduce the daily risk of infection and spread. Based on these factors, daily risk points (0 - 100) are calculated and tallied. Threshold temperatures and fules vary based on variety susceptibility.
Both versions of the index use these risk classes:
- Low
- 0-35
- Medium
- 35-65
- High
- 65-100
Note that the index considers only weather data and assumes a low level of inoculum is present. Absence of or excessively high levels of inoculum affect the accuracy of disease risk estimates.
Also, the index is calibrated to estimate disease risk for the foliar phase of the disease and should not be used for the cone phase of the disease.
Disclaimer: The index is intended to inform your decisions about management actions, such as choice and timing of control measures and intensity of scouting. It should supplement, not replace, the other factors you consider in making these decisions. Use at your own risk.
About Hop Powdery Mildew
For current information on managing powdery mildew, see the Pacific Northwest Plant Disease Management Handbook. Technical information about the model is available for on our disease risk model documentation page for both the highly susceptible varieties version and the Cascade and similar varieties version.
Email Subscription
Automated email delivery of the disease risk index outputs displayed in this app is available at no cost. An email subscription offers model results for this and several other plant disease models, for up to three weather stations, on a schedule that you select. To subscribe, you will need a uspest.org account.
Acknowledgements
- This app was funded in part by the Washington State Department of Agriculture Specialty Crops Block Grant Program, Hop Research Council, Washington Hop Commission, USDA Agricultural Research Service.
- This work was funded by grants from agencies including the USDA NIFA Western Region IPM Center, and the Oregon Agricultural Experiment Station.
- This app was funded in part by the USDA National Institute of Food and Agriculture, Crop Protection, and Pest Management, Extension Implementation Program (USDA-NIFA-CPPM-EIP).
- Dan Upper provided programming for the project.
- Location search uses data © OpenStreetMap contributors and data from MaxMind.