Introduction Suggestions for use
(NOTE: click your browser's RELOAD or REFRESH button for latest images)
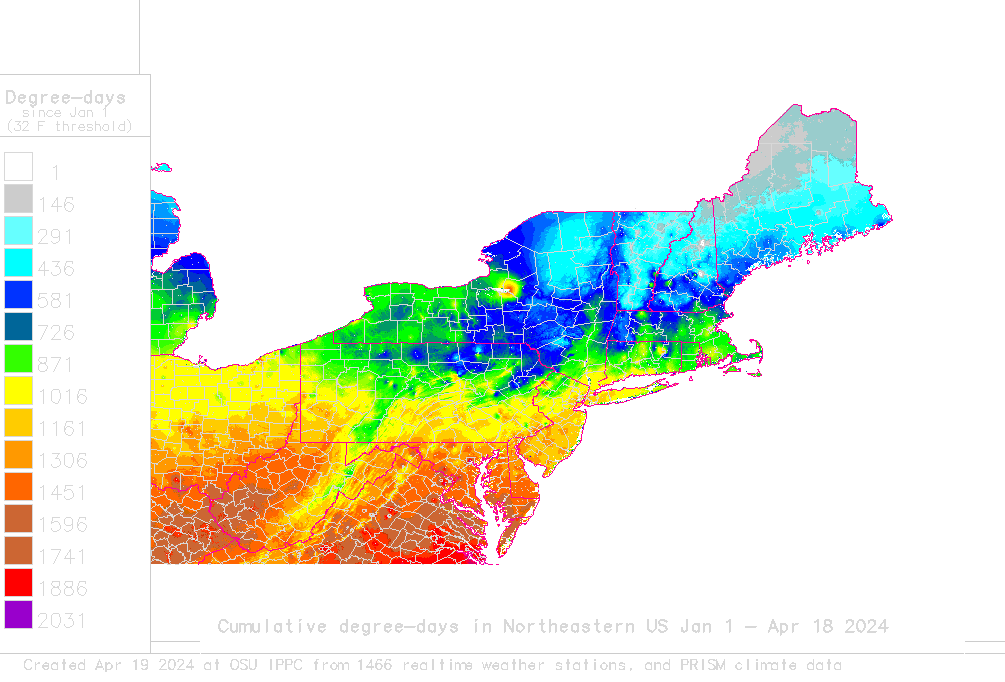
| Degree-Day Maps created daily using a 32° F. lower threshold: | |
|---|---|
| Jan 1 - yesterday | Finished Map (click for larger version) |
| Current Year
Interactive GIS interface to degree-day |
 |
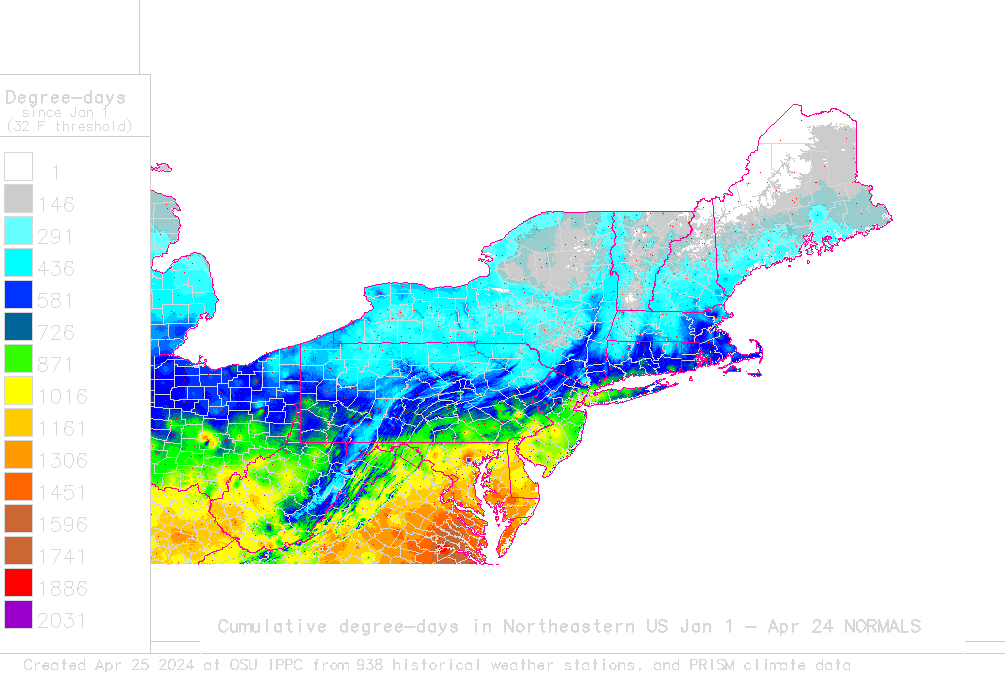
| Normals (Historical avgs) |
 |
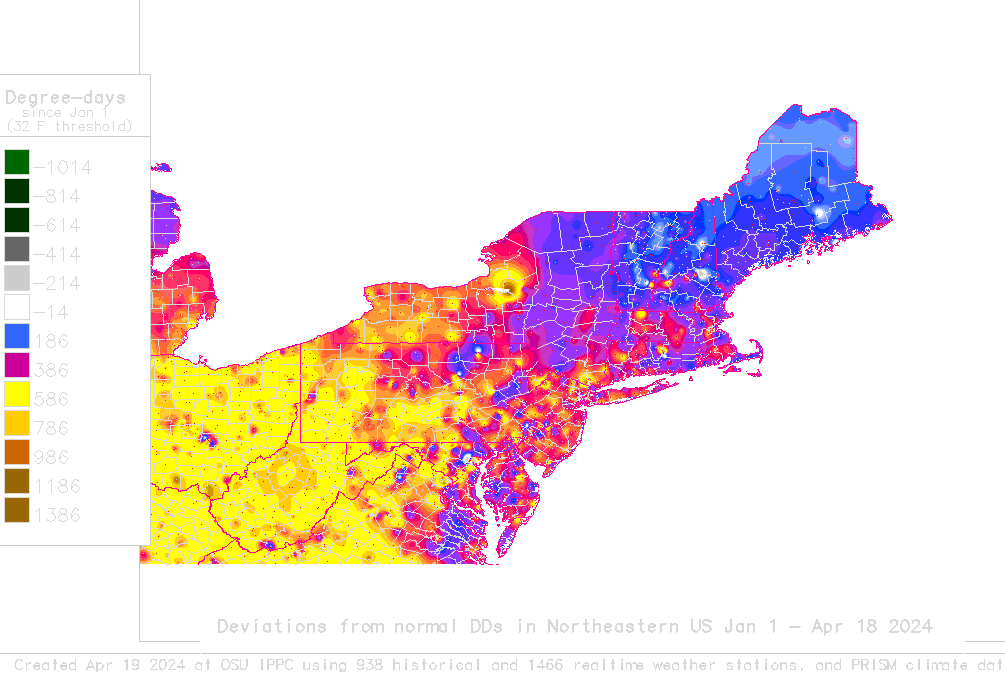
| Deviations from Normals |
 |
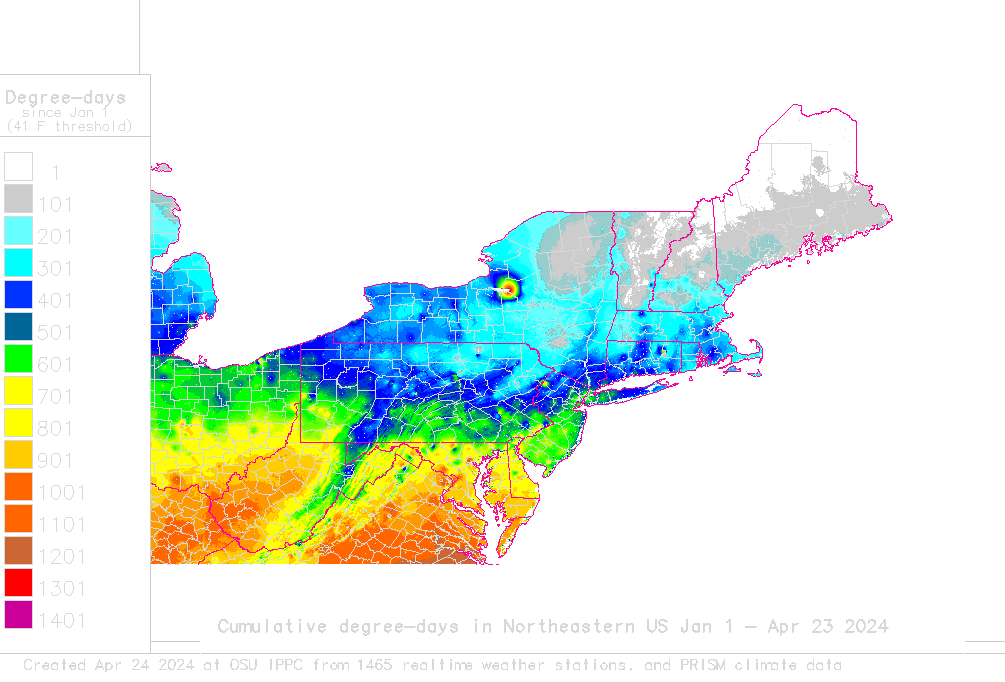
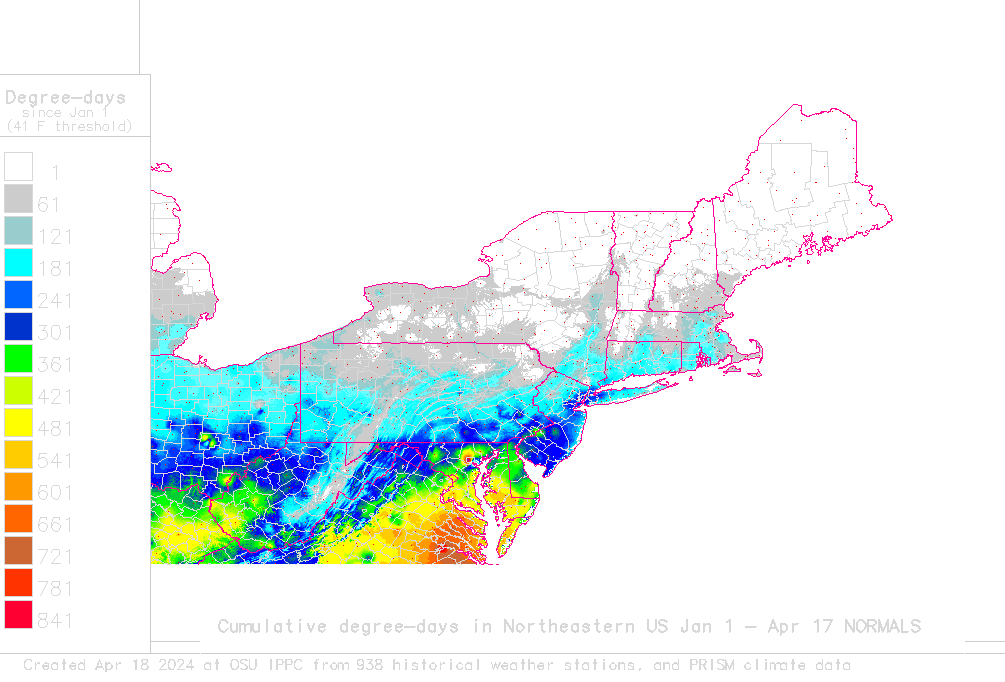
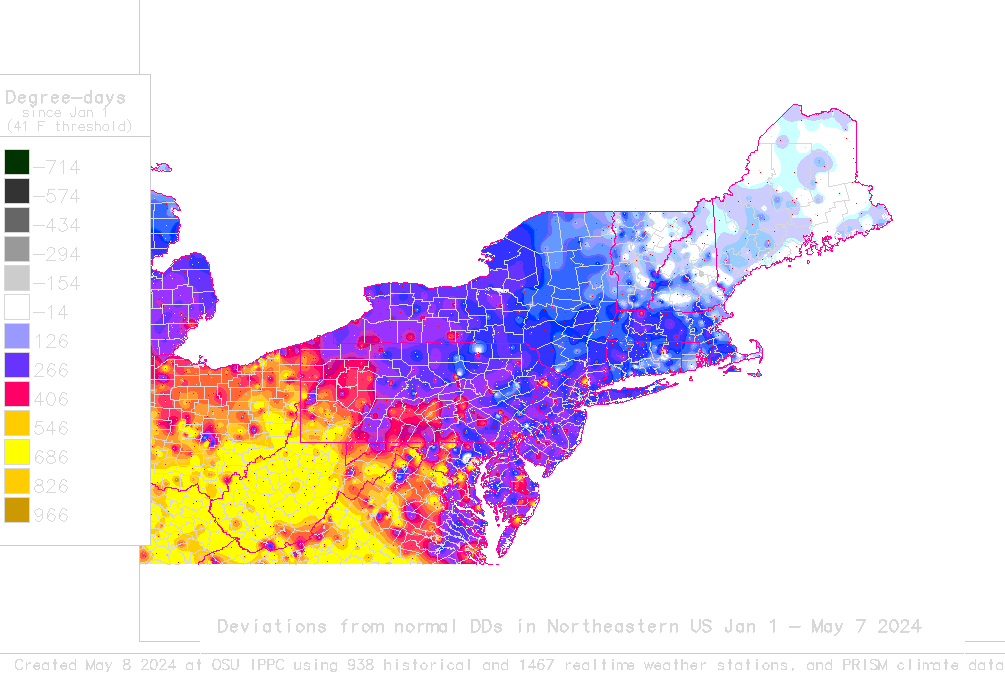
| Degree-Day Maps created daily using a 41° F. lower threshold: | |
|---|---|
| Jan 1 - yesterday | Finished Map (click for larger version) |
| Current Year
Interactive GIS interface to degree-day |
 |
| Normals (Historical avgs) |
 |
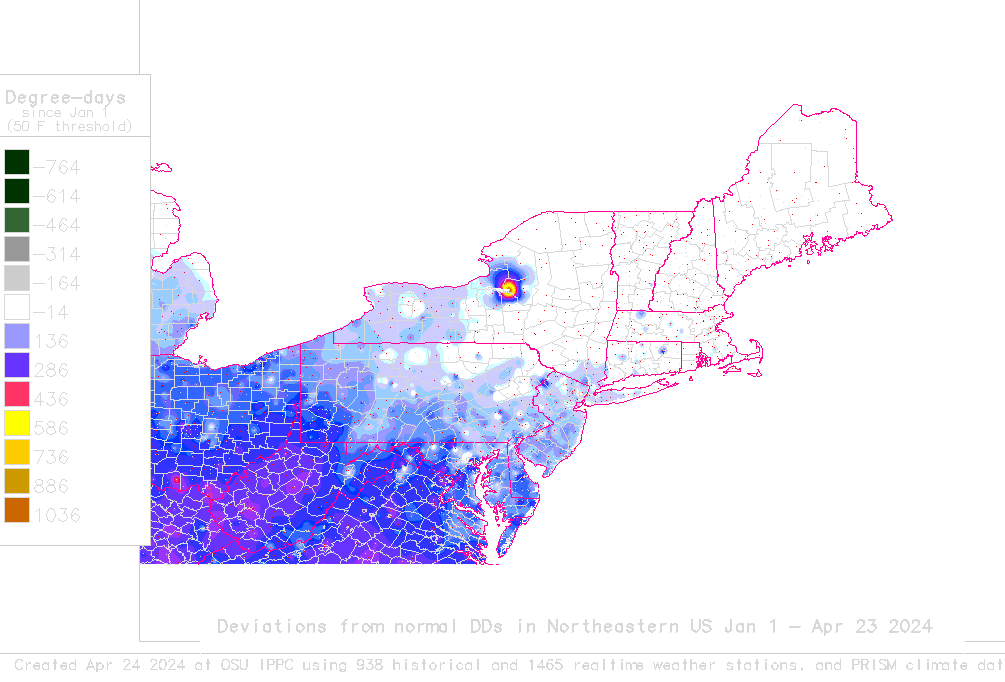
| Deviations from Normals |
 |
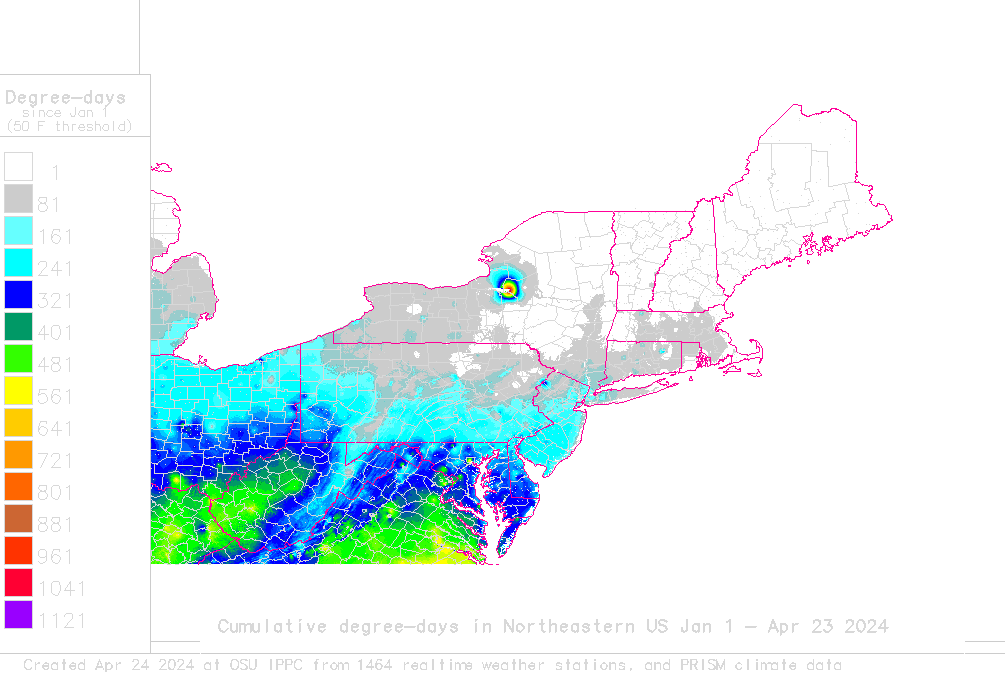
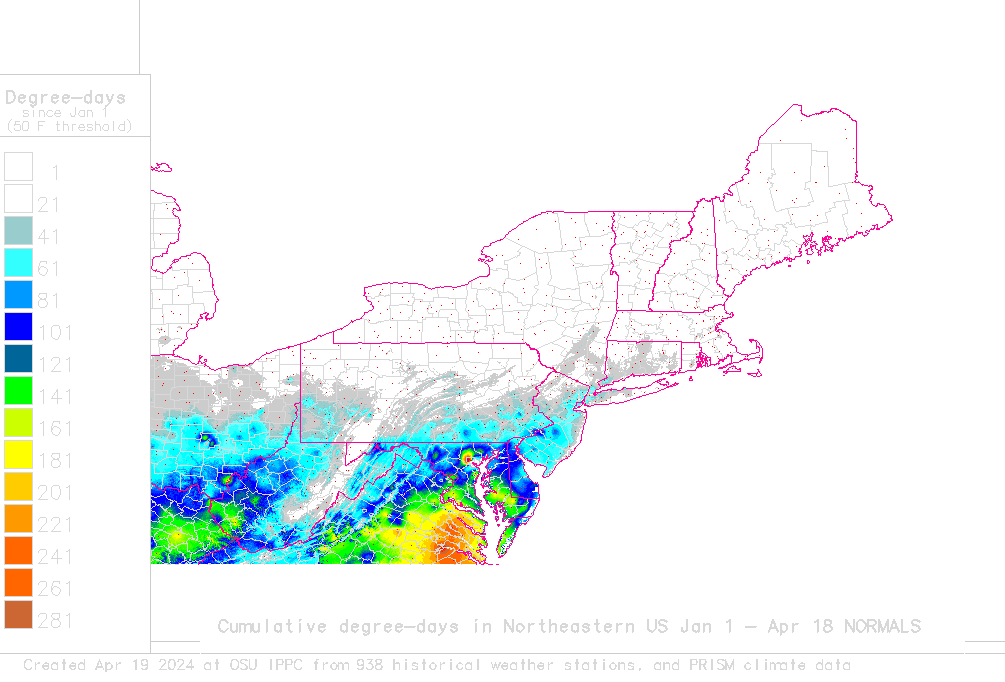
| Degree-Day maps created daily using a 50° F. lower threshold: | |
|---|---|
| Jan 1 - yesterday | Finished Map (click for larger version) |
| Current Year
Interactive GIS interface to degree-day |
 |
| Normals (Historical avgs) |
 |
| Deviations from Normals |
 |
Introduction
These maps are calculated daily using the GIS GRASS 5.4, and are based on 1) near-real time temperature data from numerous AgriMet, HydroMet, National Weather Service, RAWS, and Snotel weather stations, 2) historical average temperature data from numerous stations, 3) PRISM monthly max and min temperature maps, and 4) corrections based on inverse-distance squared inter polations of differences between PRISM map-based and real-time degree-day calculations.Ā See More info. on methodology for creating DD maps. Also try out our Degree-day Mapping Calculator for control over thresholds, calculation method, d ates, and mapping options.
Suggestions for Use
With these maps, you can 1) track the extent of degree-day (heat unit) build-up so far this growing season using 3 common thresholds: 32°, 41°, and 50° F, 2) compare this year's heat unit build-up with 30-year historical average or "normal" heat units, 3) monitor deviations between the current year and normal heat-unit build up (which indicates how much warmer or cooler than normal the year has been so far), 4) select the full region or a single state and use the interactive interface, 5) with GRASS Links, interact with these maps by zooming and querying degree-days at specific locations, and use the site-specific degree-day calculator for the nearest weather station to where you click in the map.